pymaid.cluster_by_connectivity
- pymaid.cluster_by_connectivity(x, similarity='vertex_normalized', upstream=True, downstream=True, threshold=1, include_skids=None, exclude_skids=None, min_nodes=2, connectivity_table=None, cluster_kws={}, skip_missing=True, remote_instance=None)[source]
Cluster neurons based on connectivity.
This functions offers a selection of metrics to compare connectivity:
Metric
Explanation
matching_index
Number of shared partners divided by total number of partners.
matching_index_synapses
Number of shared synapses (i.e. number of connections from/onto the same partners) divided by total number of synapses. Attention: this metric is tricky when there is a disparity of total number of connections between neuron A and B. For example, consider 100/200 and 1/50 shared/total synapse: 101/250 results in a fairly high matching index of 0.404.
matching_index_weighted_synapses
Similar to matching_index_synapses but slightly less prone to above mentioned error as it uses the percentage of shared synapses:
vertex
Matching index that rewards shared and punishes non-shared partners. Based on Jarrell et al., 2012:
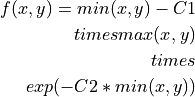
Final score is the sum of
 over all edges x, y between
neurons A+B and their partners. C1 determines how negatively a case
where one edge is much stronger than another is punished. C2
determines the point where the similarity switches from negative to
positive. C1 and C2 default to 0.5 and 1, respectively, but can be
changed by passing them in a dictionary as cluster_kws.
over all edges x, y between
neurons A+B and their partners. C1 determines how negatively a case
where one edge is much stronger than another is punished. C2
determines the point where the similarity switches from negative to
positive. C1 and C2 default to 0.5 and 1, respectively, but can be
changed by passing them in a dictionary as cluster_kws.vertex_normalized
This is vertex similarity normalized by the lowest (total dissimilarity) and highest (all edge weights the same) achievable score.
- Parameters:
x –
Neurons as single or list of either:
skeleton IDs (int or str)
neuron name (str, exact match)
annotation: e.g. ‘annotation:PN right’
CatmaidNeuron or CatmaidNeuronList object
similarity ('matching_index' | 'matching_index_synapses' | 'matching_index_weighted_synapses' | 'vertex' | vertex_normalized', optional) – Metric used to compare connectivity. See notes for detailed explanation.
upstream (bool, optional) – If True, upstream partners will be considered.
downstream (bool, optional) – If True, downstream partners will be considered.
threshold (int, optional) – Only partners with more this synapses are used for comparison. This threshold applies to the total number of connections from/to all neurons in
x.min_nodes (int, optional) – Minimum number of nodes for a partners to be considered.
include_skids (see
x, optional) – If filter_skids is not empty, only neurons whose skids are in filter_skids will be considered when calculating similarity score.exclude_skids (see
x, optional) – Neurons to exclude from calculation of connectivity similarity.connectivity_table (pd.DataFrame, optional) – Connectivity table, e.g. from
get_partners(). If provided, will use this instead of querying CATMAID server. Filters still apply!skip_missing (bool, optional) – If True, neurons that don’t have connectivity data (i.e. no up-/ and/or downstream partners after filtering) will be skipped. If False, will keep them but they will have similarity
nan.remote_instance (CatmaidInstance, optional) – If not passed, will try using globally defined.
- Returns:
Custom cluster results class holding the distance matrix and contains wrappers e.g. to plot dendograms.
- Return type:
Examples
>>> import matplotlib.pyplot as plt
>>> # Cluster a set of neurons by their inputs (ignore small fragments)
>>> res = pymaid.cluster_by_connectivity('annotation:PBG6 P-EN right',
...                                      upstream=True, downstream=False,
...                                      threshold=1, min_nodes=500)
>>> # Get the similarity matrix
>>> print(res.sim_mat)
>>> # Plot a dendrogram
>>> fig = res.plot_dendrogram()
>>> plt.show()